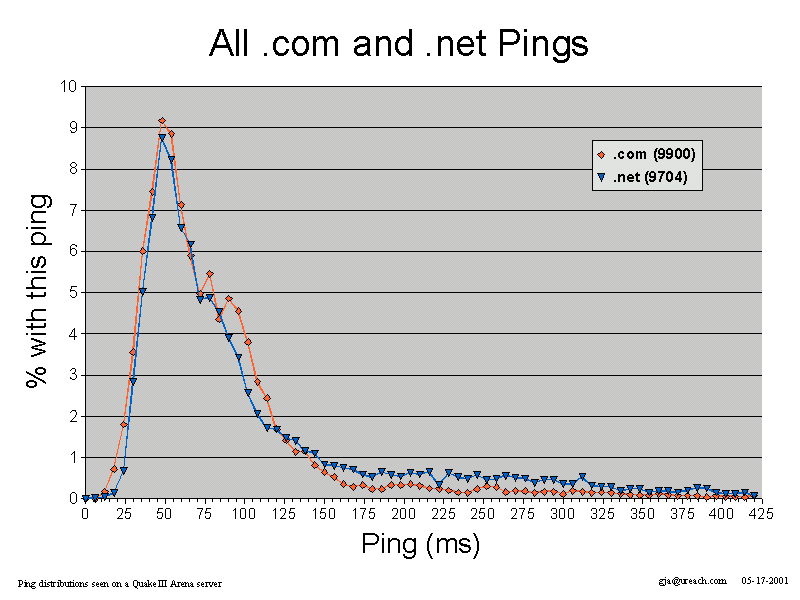
Figure 1 Latency distribution
under .com and .net
(Click on image for full
size version)
Most people who've played,
or watched, fast-paced networked 'first person shooter' (FPS) games recognize
that network latency (sometimes referred to as 'lag' or 'ping time') can
critically affect a player's success in the game. The latency represents
the time it takes packets from your client to reach the server, and
vice-versa. FPS games typically require quick reaction to events generated
by other players, so it is intuitively obvious that players with lower
network latency are at an advantage relative to players with higher network
latency. But what exactly is 'higher', and how high is too high?
Based on my study of QuakeIII Arena players on two servers between February and April 2001, I believe 'too high' begins at around 150 milliseconds (ms). Anything above 200 milliseconds is definitely too high. My argument isn't based on studies of reaction times. Rather, it is based on the distribution of ping times of the players who used my server the most. I surmise that people choose servers they find are fun to play, and part of this process involves bias towards servers with tolerable latencies. The most common ping times reported on my servers thus represent the range of latencies that players find tolerable.
The upper bound on tolerable latency isn't entirely an academic question. If you run an FPS game server, your potential player base will be dominated by people whose network connections put them within tolerable latency range of your server. If you're hoping to make money from an FPS server service, the first step is to know your target market potential - and for that you need to know the upper bound on tolerable latency.
The rest of this report describes
the server set up, how ping times were extracted, and the limitations of
these results. My results aren't rigorously defended, and there are
weaknesses in my methodology. Please feel free to provide suggestions that
you think would improve the analysis. (Related reports
look at the ratio of
users who play
from home, and the use of NAT/NAPT boxes by QuakeIII players, and when
people seem to play the most.)
Players
are very aware of the lag between themselves and any given server. Most
FPS game clients (including the QuakeIII client) provide regular updates
of the current lag relative to that player's location, and external game
launchers (such as GameSpy3D)
allow players to search for servers based on an estimate of the lag between
the player's location on the network and the available servers. The attractiveness
of any given server depends on both the likely lag and the existence of
other players on the server. A player will generally choose the lowest
lag server that has players on it and free space for the new player. High
lag servers are generally only chosen if there's no free space on server's
with lower lag, or simply no servers at all with lower lag.
I ran two public QuakeIII Arena game servers between mid-February 2001 and the end of April 2001. Over 65 calendar days the servers saw 9068 unique IP addresses, of which 7291 (80.4%) could be resolved to domain names. Given that the server was open to anyone from around the world, domain names allowed me to filter players and observe domain specific trends in ping times.
The servers ran 7x24 on a single machine (600MHz Celeron, 128MB, FreeBSD4.2, Linux QuakeIII v1.17 dedicated server binary) hosted at a private residence on the US West coast (Palo Alto, California), connected via a dedicated T1 line to a local, well-connected ISP. Each server had its own separate four-map cycle, ran two 'bots' to attract players, and was limited to a maximum of 6 additional (remote) clients at a time. Each server logged the player-assigned ASCII playernames, IP addresses, and join/leave times of every seen player.
Each game consisted of about 15 to 20 minutes of playing time on a particular map. At the end of each game the server would move to the next map in its cycle. Each map also had a certin kill ('frag') limit, so a game would end if one of the players reached the frag limit before the timelimit expired. The map cycle would pause if, at the end of a game, the only players left were the two 'bots'. The map cycle would resume again when a remote player (or players) connected.
The server logs the names
of the players who were still active at the conclusion of each game, and
their ping times as perceived by the server. I use these end-of-game ping
values as my data source (which happens to exclude many of the 'tourists'
who would just log into the server briefly). Each data point represents
"one player on one game ended the game with this ping value". Multiple
data points are created by a single player playing multiple games, multiple
players playing a single game, or varying mixtures of both.
To get a sense of how 'popular' different latencies were, I created histograms of ping time vs the percentage of games seen with the given ping time. Each histogram focussed on particular subsets of the players seen on my servers, filtering based on the domains from which the players connected. The results are comforting in that they support reasonable expectations - latency distributions from topologically close domains were lower than those from topologically distant domains.
It is worth noting the following about my histograms:

Figure 1 Latency distribution
under .com and .net
(Click on image for full
size version)
Figure 1 shows by far the majority of games were played by people having ping times between 20ms and 150ms, with a primary component being between 30ms and 100ms. Above 150ms the number of data points drops off into the noise. The lower bound on latency is set by the intrinsic limitations of the Internet paths between players and my server.
Of course, the .com and .net domains are made up of many different ISPs having different topological relationships to my server. It is educational to look at the ping time distributions between and within a number of ISPs (identified from their domain names).
Figure 2 shows the different ping time distributions of players coming in from the .home.com, .shawcable.net, and .rr.com domains (three cable internet providers in North America).
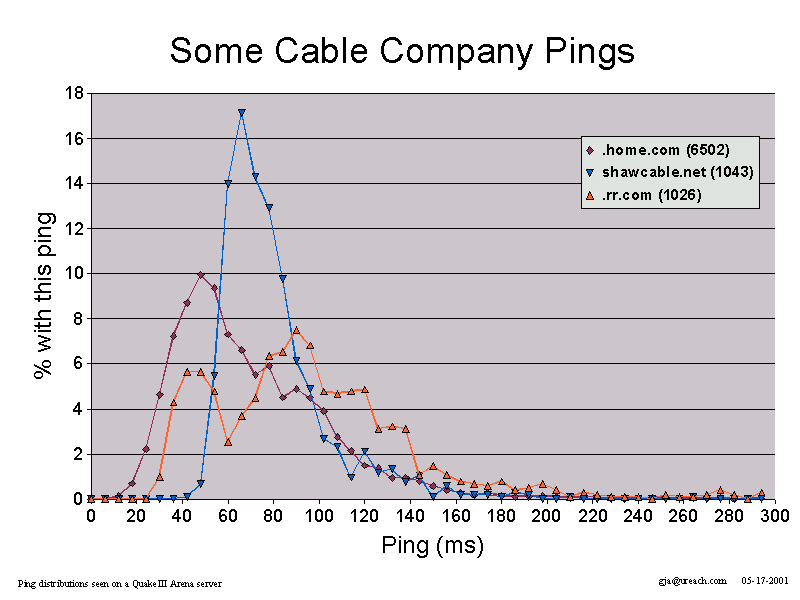
Figure 2 Latency distributions
under @Home, ShawCable, and RoadRunner
(Click on image for full
size version)
Figure 2 shows the usage in all three domains dropping off significantly for latency over 150ms, consistent with the trend in Figure 1. Interestingly, it also reveals definite differences in the connectivity between my server and each domain. Players from the @Home cable network see generally lower latency than players from Shawcable and RoadRunner.
Not surprisingly, geography plays a part in the experienced latency. Figure 3 breaks down the @Home network's players into four subdomains - sfba.home.com (presumably San Francisco Bay Area), .or.home.com (presumably Oregon), .tx.com (presumably Texas), and .nj.com (presumably New Jersey). There were many other domains, but these four illustrate the point clearly enough.
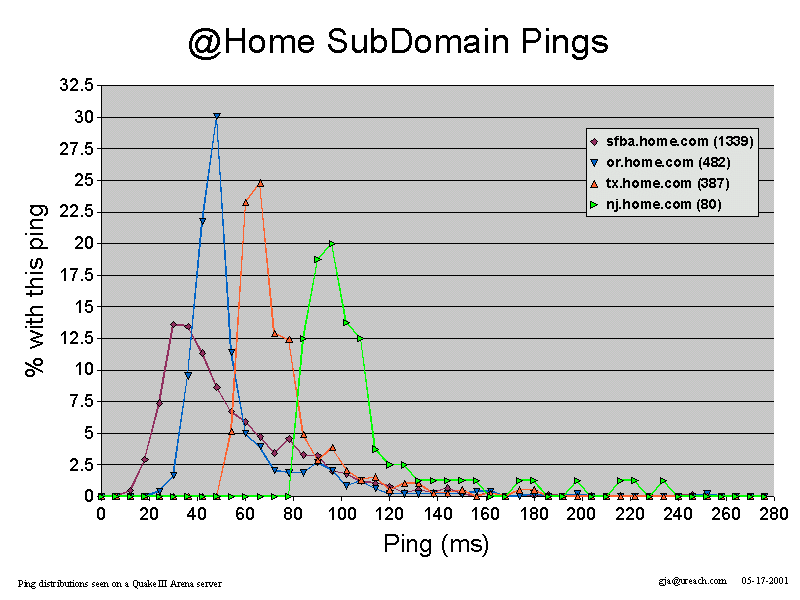
Figure 3 Latency distributions
for @Home subdomains
(Click on image for full
size version)
The four latency distribution curves show broadly similar shapes, but quite distinctly different lower latency bounds. Players from the bay area (local to the server) show latencies from 20ms up, from oregon 30ms up, from texas 55ms up, and from new jersey the lower bound is 80ms. The trend is consistent with each state being further away (topologically and geographicall) from the server. Yet in every case the distributions tail off into the noise for latency above 150ms.
Similar influence of geography can be seen in Figure 4, where I pulled out separate histograms for .pacbell.net, .uswest.net, .swbell.net, and bellatlantic.net - IP services associated with four RBOCs (regional bell operating companies) in the US.
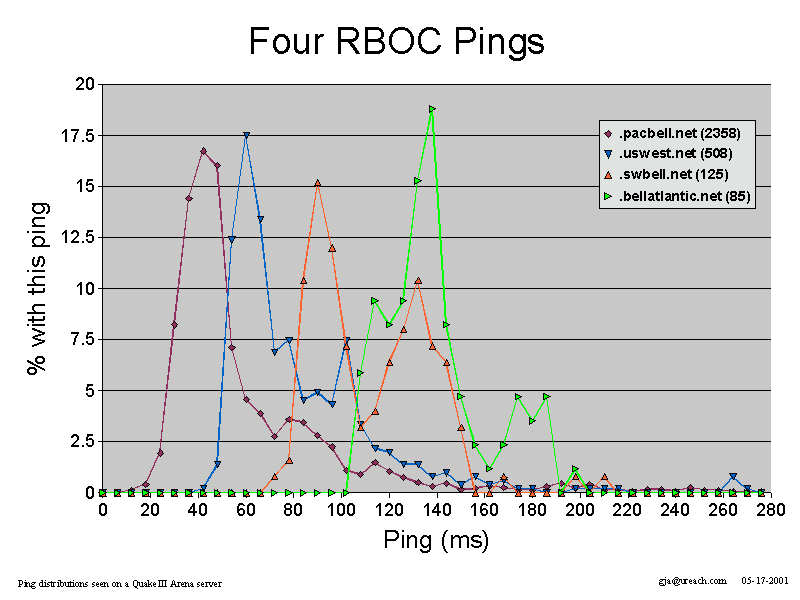
Figure 4 Latency distributions
for four RBOCs
(Click on image for full
size version)
As with Figure 3, the curves in Figure 4 show broadly similar shapes with the lower bounds clearly depend on geographical/topological relationship between my server and the source domains. Players on Pacbell's network have a lower bound around 20ms, US West's network saw a lower bound of 45ms, South Western Bell's network saw a lower bound of 80ms, and Bell Atlantic saw a lower bound around 110ms. Not surprisingly the lower bound rises for source domains further away from Palo Alto, Calfornia. Yet as in Figure 3, for each domain the data points trail off into the noise for latencies above 150ms (aside from Bell Atlantic having a small spike just below 200ms).
Some of the players on my servers were from non-US locations, and their latency distributions show the impact of their topological distance. Figure 5 shows the histograms for the most frequent three non-US locations - .jp (Japan), .au (Australia), and .nz (New Zealand).
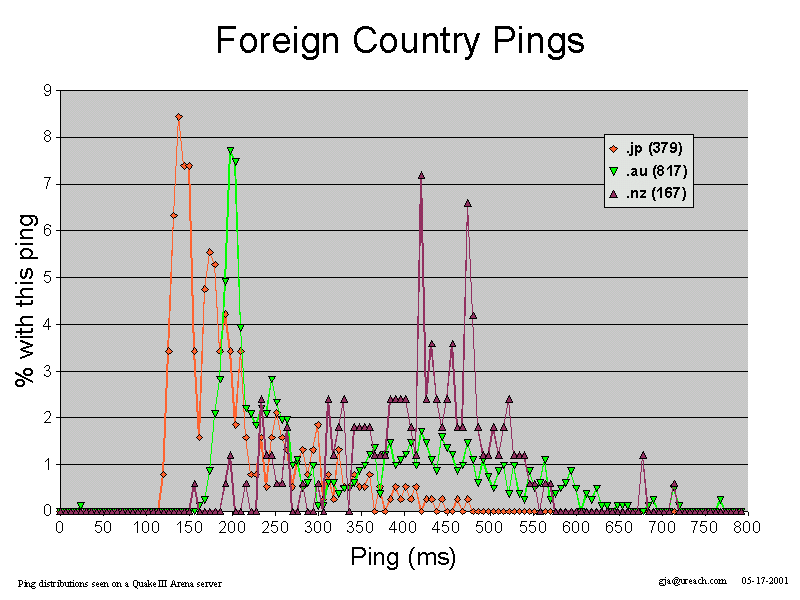
Figure 5 International
latency distributions
(Click on image for full
size version)
Figure 5 deserves some additional comment because it shows distributions for latency well above 100 ms. Japan's curve has a lower bound around 120ms but seems to be tapering off significantly beyond 250ms. Australia's curve has a lower bound around 175ms and drops off around 275ms, with small resurgance in the 300ms to 550ms range. The majority of New Zealand's curve is spread widely over 200ms to 550ms.
However, note that the number
of data points for Australian and New Zealand players is low relative
to the total number of data points making up the curves for .com and .net.
I believe Figure 5 represents the activities of players who needed a 'fix'
of their favorite FPS game, but lacked any more topologically preferable
servers from which to choose. It shouldn't be taken as proof that antipodeans
like playing with high lag.
I surmised that people's criteria of whether a server will be fun to play on involves a bias towards servers with 'low' latencies. Thus, working backwards from the frequency with which certain ping times are reported on my servers, I've drawn conclusions about the range of latencies that players find tolerable. The histograms appear to bear out the hypothesis that FPS games really only work well (are 'fun to play', all other things being equal) when the latency is under 150 milliseconds. The histograms also agree with our intuitive expectation that players located topologically further from the server will show a higher 'lower bound' on latency.
There's another aspect of these results that suggests a server's audience pool is primarily made up of people under 150-200ms of the server's location on the Internet. The number of data points in Figures 3 and 4 drops off as the source (sub)domain gets topologically further away. A couple of factors may be at work here - different domains may have quite different populations of game players, different domains may have different levels of dedication among their game players, and increasing latency scares off all but hard-core gamers needing a 'fix'. For example, there is a rather extreme ratio of data points between Pacbell and Bell Atlantic in Figure 4 (85/2358 = 3.6%), so I believe high average latency played a part in scaring off distant Bell Atlantic gamers who might otherwise have frequented my server.
I have not considered the actual sources of latency to be an issue worth analysing, since most players have minimal control over this variable (beyond turning off the compression on their dial-up modems). Contributions to latency include 'speed of light' (even a straight piece of fiber across country adds a couple of milliseconds), topological complexity (both internal to an ISP, and in an ISP's peering arrangements), and access technoogy (e.g. dial-up modems vs cable modems vs DSL). Although typical QuakeIII traffic is a relatively consistent stream of sub-100 byte packets at rates below 30 kbit/sec, today's Internet doesn't support any priority for game traffic to help keep latency low and predictable. It is what it is, and when it gets over 150ms players seek other servers.
There are a number of considerations to keep in mind when drawing conclusions from this data:
Based on analysis of a QuakeIII
server over two months in early 2001, first person shooter (FPS) game players
strongly prefer servers that are within 150 milliseconds of the player's
attachment point to the Internet. Or put another way, if you are planning
on hosting a for-fee FPS server service, you should forget about trying
to get customers who are more than 150 milliseconds away from your servers.
Sections of the Internet more than 150 milliseconds away will provide a
minimal source of regular players (and hence minimal revenue).