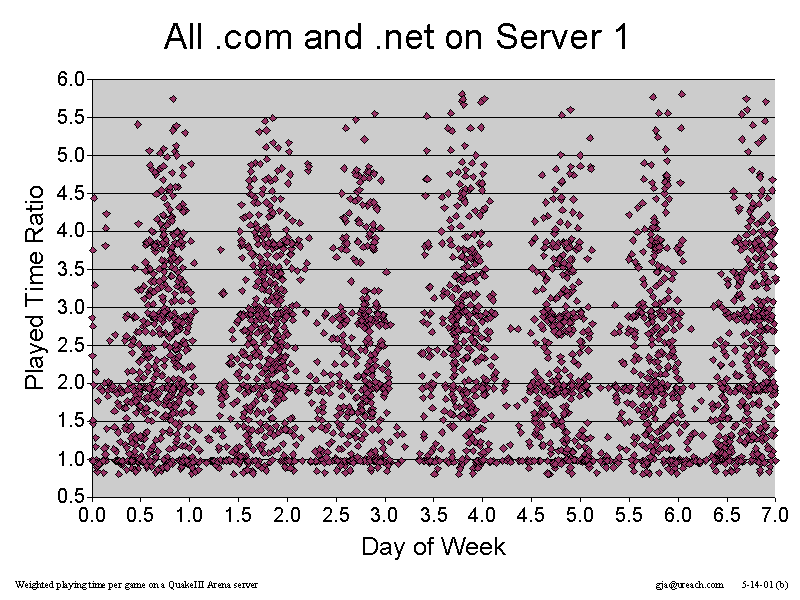
Figure
1A Server 1 usage from .com and .net
(click
the figure for full size image)
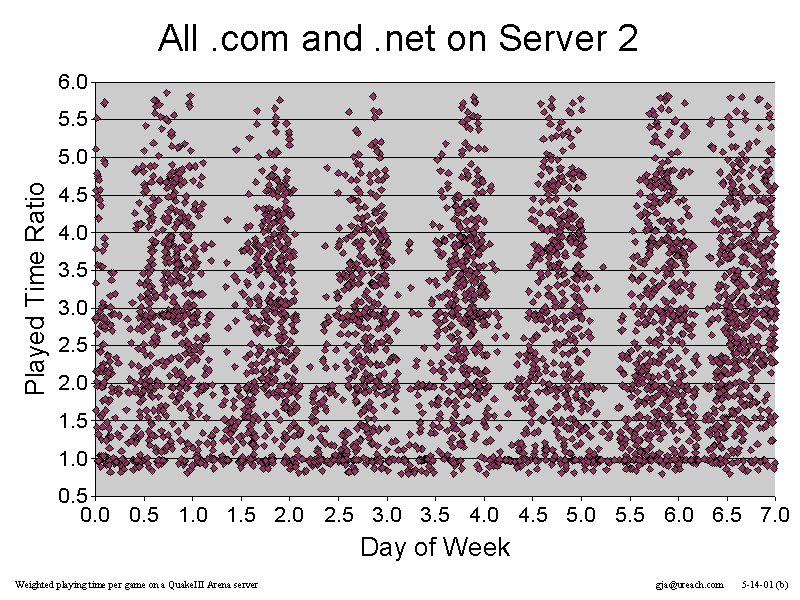
Figure
1B Server 2 usage from .com and .net
(click
the figure for full size image)
Real-time,
interactive games are poised to become a key driver for adding QoS capabilities
to last-mile/first-mile consumer IP access services (such as DSL, CableModem,
and 56K dial-up). Unfortunately the industry lacks much insight into the
usage patterns of such game players, and therefore their relevance to ISP
network provisioning and engineering efforts. Work
by Tristan Henderson at UCL used external polling of game servers to
determine usage patterns. My study directly utilizes the logfiles of two
game servers to provide a similar insight into distribution of playing
times across days of the week. (A related report looks at the ratio of
users
who play from home, and the use of NAT/NAPT boxes by QuakeIII players.)
I ran two public QuakeIII Arena game servers between mid-February 2001 and the end of April 2001. Over 65 calendar days the servers saw 9068 unique IP addresses, of which 7291 (80.4%) could be resolved to domain names. Given that the server was open to anyone from around the world, domain names were used to filter players out and focus on usage patterns from geographically specific domains.
Based on analysis of players in the .com and .net domains, I saw strong game play from midday to middnight local time (US Pacific Standard Time) every day of the week. Game play was low from the early hours of each morning until prior to midday. These results suggest many of the players were living in, or close to, the PST timezone, and that even hardcore gamers need to sleep.
The
rest of this report describes the server set up, how I define 'usage',
and the limitations of these results. My results aren't rigorously
defended, and there are weaknesses in my methodology. Please feel free
to provide suggestions that you think would improve the analysis.
The servers ran 7x24 on a single machine (600MHz Celeron, FreeBSD4.2, Linux QuakeIII v1.17 dedicated server binary) hosted at a private residence on the US west coast, connected via a dedicated T1 line to a local, well-connected ISP. Each server had its own separate four-map cycle, ran two 'bots' to attract players, and was limited to a maximum of 6 additional (remote) clients at a time. Each server logged the player-assigned ASCII playernames, IP addresses, and join/leave times of every seen player.
Each game consisted of about 15 to 20 minutes of playing time on a particular map. At the end of each game the server would move to the next map in its cycle. Each map also had a certin kill ('frag') limit, so a game would end if one of the players reached the frag limit before the timelimit expired. The map cycle would pause if, at the end of a game, the only players left were the two 'bots'. The map cycle would resume again when a remote player (or players) connected.
Later
in this report I'll refer to Server 1 (covering 65 days, 14 hours ) and
Server 2 (covering 61 days, 3 hours). Both servers began on the same day
in mid-February, were shutdown and restarted (to archive logfiles) at roughly
the same points throughout the trial period, and were finally shutdown
on the same day in late April. (The difference in total time covered by
each server is due to a brief period where Server 1 was running and Server
2 hadn't been restarted.)
From the server logs I calculated the duration of each game (Tg) and whether they ended due to time limit or frag limit being reached. I also calculated the total playing time of all players seen during each game (Tp). For this report my simple 'usage' metric (U) is the ratio of the total time played by remote players to the total game time, for each game (so U = Tp/Tg).
With this metric, values above 1.0 represent cases where more than one player (on average) stayed logged in and playing during the entire game. Values substantially below 1.0 represent games that were triggered by someone logging in briefly and disappearing, and didn't have any one player staying for a substantial fraction of the game's duration. In other words, U roughly represents the average number of players over the duration of a game.
Usage
can also be considered in terms of how frequently maps were played, and
how often they were played back-to-back. For the moment I have not done
any analysis along those lines.
To get a visual sense of when people play, and see any weekly and daily trends, I plotted the usage (Tp/Tg) against time on a scatter (XY) graph, with the time axis representing the absolute day of the week in decimal (0.00 being 12AM Sunday, 1.0 to 1.99 being Monday, and 6.99 being 11:59PM the following Saturday). The absolute time of each game (relative to Jan.1st 1970) was used to calculate which day of the week (in local time) the game was played. Local time is Pacific Standard Time (PST), California.
To reduce visual clutter on the graphs, I only include games where the calculated value of U is greater than 0.8, removing cases where the map was triggered by (or played by) tourists.
My servers saw clients from many locations around the world. However, by far the majority fell under the ".com" and ".net" domains. My first analysis shows the usage patterns (distribution of U versus time) for players whose resolved IP address fell under .com or .net (Figure 1).

Figure
1A Server 1 usage from .com and .net
(click
the figure for full size image)

Figure
1B Server 2 usage from .com and .net
(click
the figure for full size image)
Figure 1 shows that both servers see usage increasing rapidly around midday local time, staying strong through to middnight local time, then droping off into the early hours of the next morning. During the early morning to midday period there's still a scattering of players, but the majority play in the afternoon and evening.
Since I've included all .com and .net players, it seems likely that what we're seeing are players from across the entire US (being the dominant source of .com and .net addresses). East coast and Mid-West players joining in the mid-afternoon their time would contribute to the usage patterns around/before midday as far as my servers were concerned.
The top two subdomains of .com and .net respectively were ".home.com" and ".pacbell.net". It seems likely (although by no means certain) that many players coming in from .pacbell.net addresses are geographically closer to PST. Figure 2 shows the usage patterns for players whose resolved IP addresses fell under .pacbell.net.
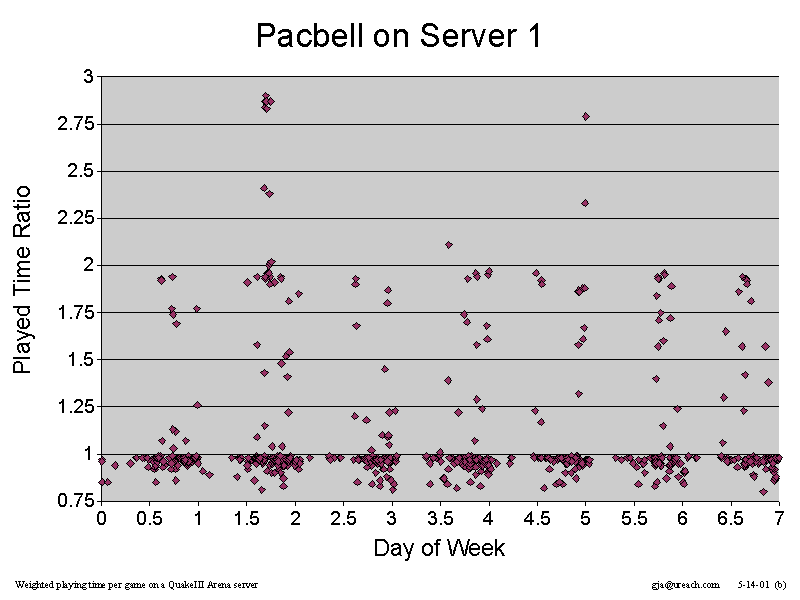
Figure
2A Server 1 usage from .pacbell.net
(click
the figure for full size image)

Figure
2B Server 2 usage from .pacbell.net
(click
the figure for full size image)
The playing population under .pacbell.net shows a similar pattern to Figure 1, in that players start appearing just before midday and continue on to just after middnight each day. The apparent sparseness of U values above 1.0 also suggesst many games did not have more than one player (on average) from .pacbell.net.
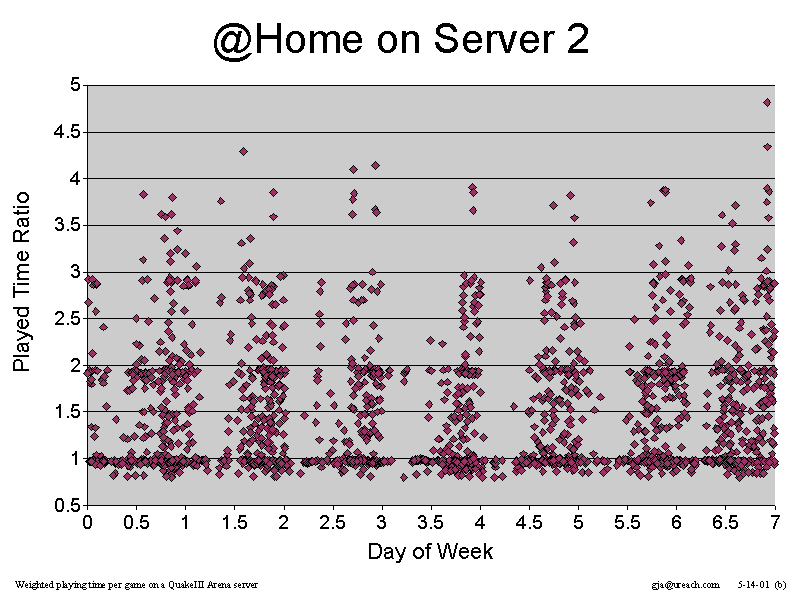
Figure 3 shows usage patterns for players whose resolved IP addresses fell under .home.com (the "@home" network). Again, there's a usage pattern similar to that in Figure 1. Comparing Figure 2 and Figure 3 shows that .home.com provides a more active source of players than .pacbell.net.
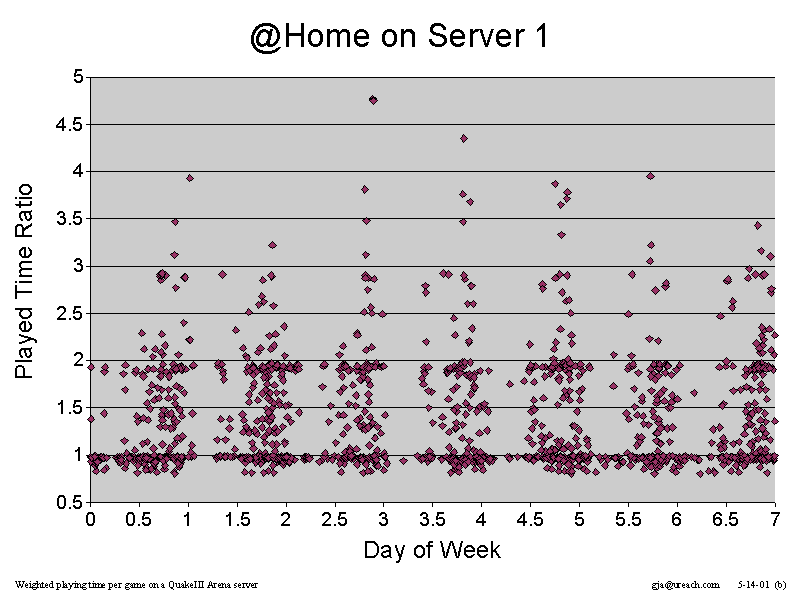
Figure
3A Server 1 usage from .home.com
(click
the figure for full size image)
Figure
3B Server 2 usage from .home.com
(click
the figure for full size image)
Based on a visual estimate of the varying density of data points in Figures 1, 2, and 3 it seems that game playing has definite daily cycles, with preference being given to the hours between midday and midnight. However, lacking a more precise quantification of the usage patterns versus time I cannot state whether weekends see more play than weekdays.
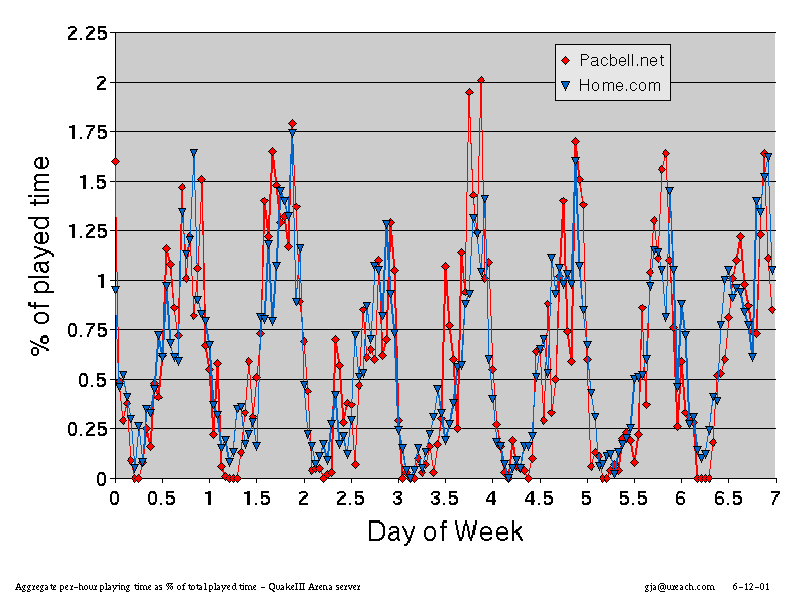
As an alternative to the scatter plots above, I've created a histogram of total playing time per hour over the days of the week. In Figure 4 below, the data points represent the percentage of total played time during any given one-hour interval during the week.
Figure
4 Hourly aggregate playing time, both servers
(click
the figure for full size image)
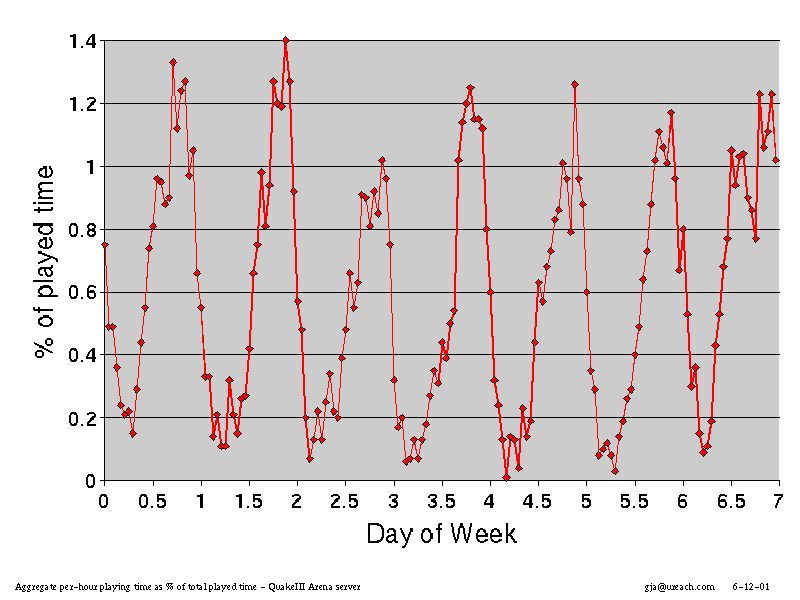
Figure 4 covers games from both server 1 and server 2, but only counts the time played by players whose resolved IP address fell under the .pacbell.net or .home.com domains. The cyclical trend is much clearer than in the preceding scatter plots. Figure 5 expands a little on this by showing the same plot for all players under .com and .net for both server 1 and server 2.
Figure
5 Hourly aggregate playing time, both servers, .com and .net
(click
the figure for full size image)
Although the results reveal server utilization trends, they do not directly explain why people chose to use the server when they did. Once a player has decided to go online and play games, the player's choice of server depends on additional variables:
There
may also be gravity at work - the attraction of a server that already has
people on it. Given the choice of a server with low ping but no humans,
and a server with higher ping but other player, many players will tolerate
the higher ping times in order to play against real people. One consequence
is that players who are topologically distant from the server may still
choose to show up during the midday to midnight period PST, simply because
the high numbers of 'local' players make the server attractive. (In the
same way, placing two bots on each server helped make the server slightly
more attractive during relatively idle periods. The bots were named Hunter(bot)
and Orbb(bot) so that players would nevertheless know what they
were playing against.)
There are a number of considerations to keep in mind when drawing conclusions from this data:
Using
two public QuakeIII servers to attract 8954 game players over a period
of 65 calendar days. Based on analysis of players in the .com and .net
domains, I saw strong game play from midday to middnight local time (US
Pacific Standard Time) every day of the week. Game play was low from the
early hours of each morning until prior to midday. These results suggest
many of the players were living in, or close to, the PST timezone, and
that even hardcore gamers need to sleep.
Tristan Henderson (UCL) has done some prior work analysing usage patterns of Half Life servers. Have a look at:
Grenville
Armitage, 5/14/01
updated
5/23/01 to add GIF figures and link to latency results